The following maps were created in partnership with the University of Wisconsin and use statistical downscaling to project changes to Minnesota's climate at the end of the century (2100). Below are a variety of maps showing projected changes to temperature and precipitation for two different emission scenarios (RCP4.5 and RCP8.5) and two different time periods in the future, including mid-century (2041-2060) and end-of-century (2081-2100). Please see the Glossary of Terms and Citations below for more information on these climate projection data. Updated results from newer CMIP6 projections that use dynamical downscaling are now available as interactive maps in our Minnesota CliMAT (Climate Mapping and Analysis Tool).
Changing Extremes
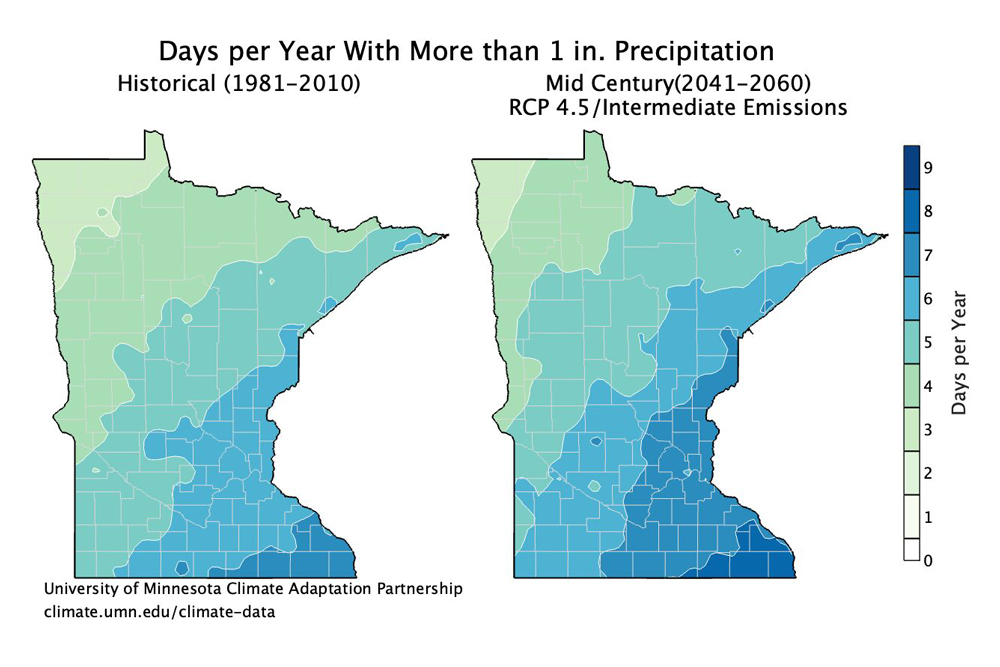
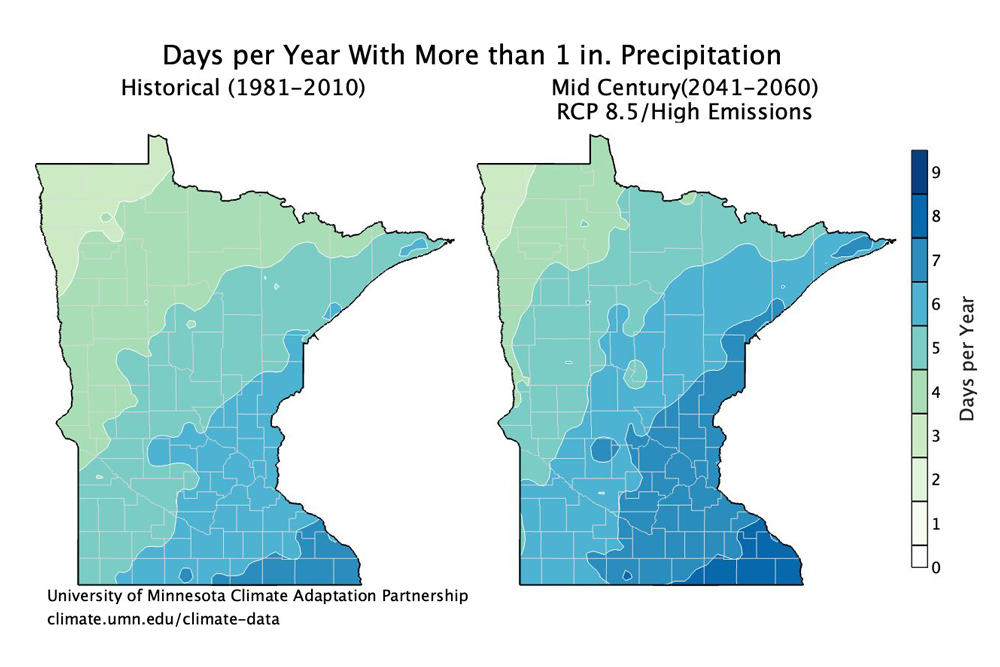
Days per year with more than 1 inch of precipitation
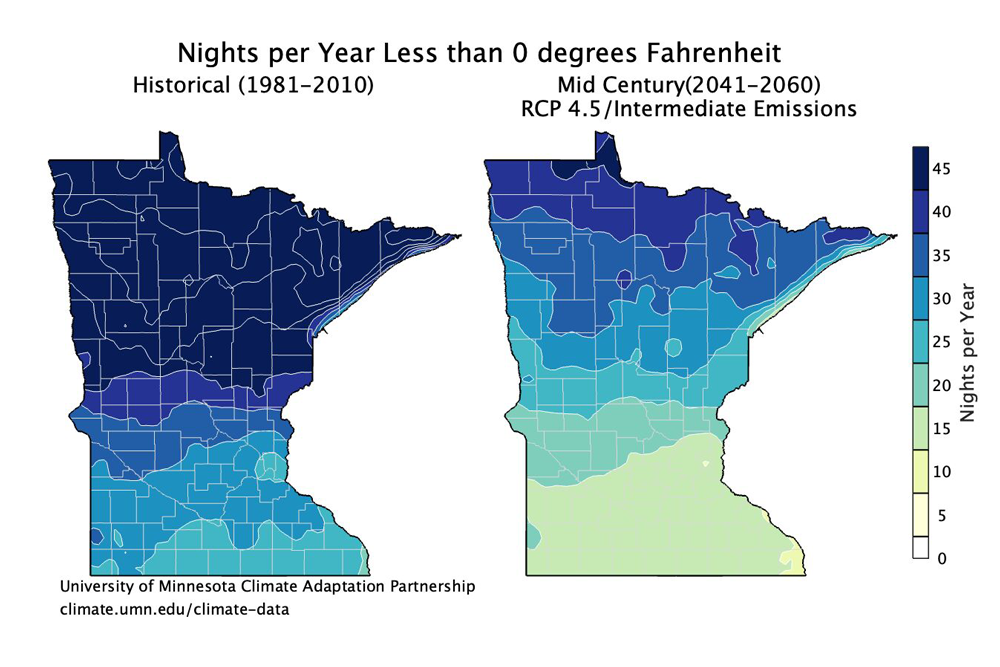
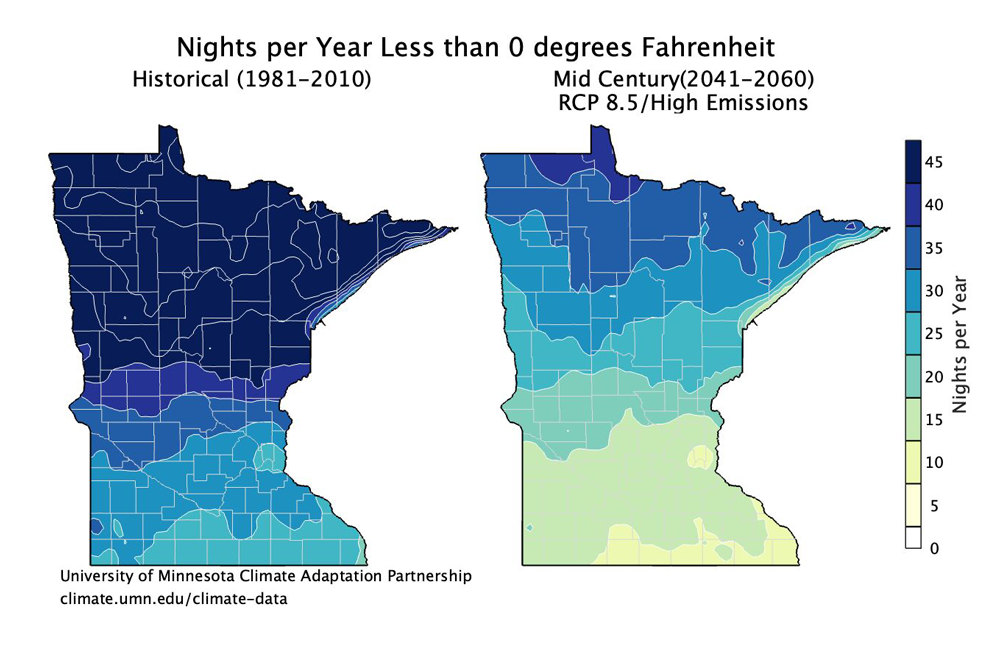
Nights per year less than 0 degrees F
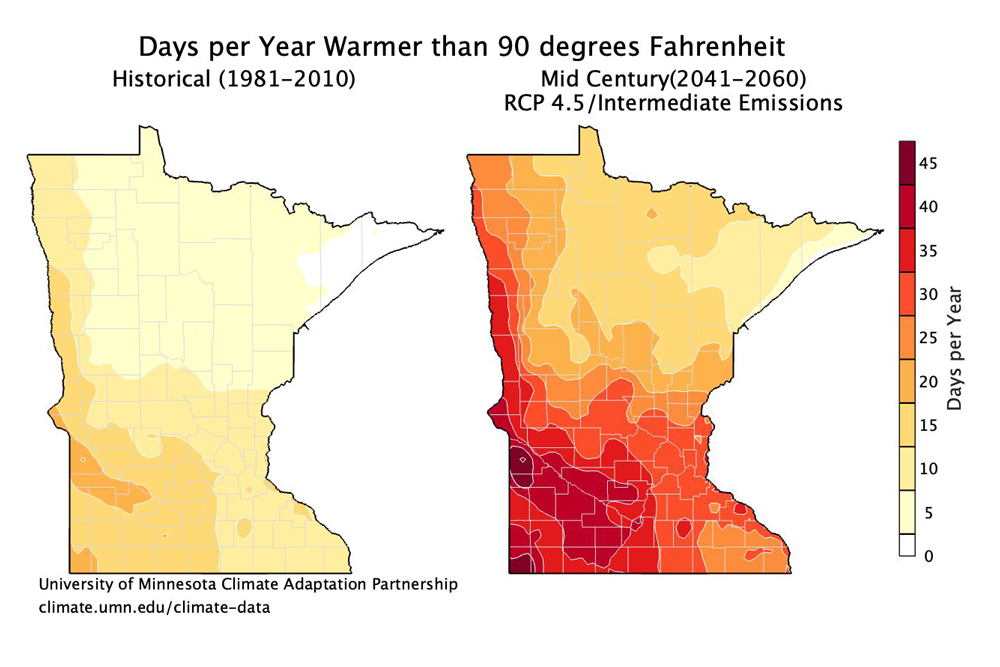
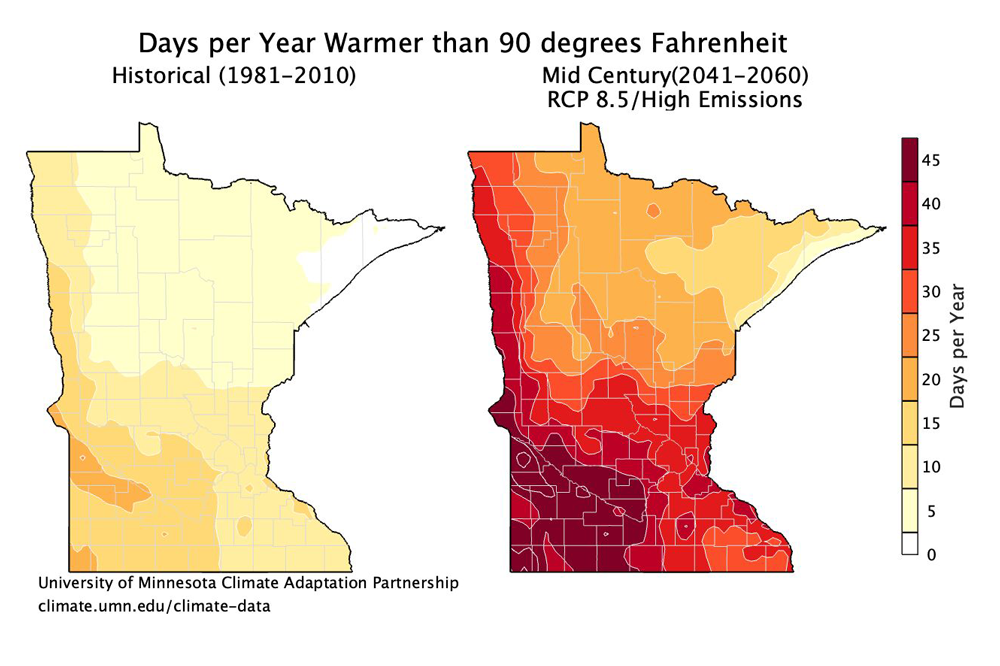
Days per year warmer than 90 degrees F
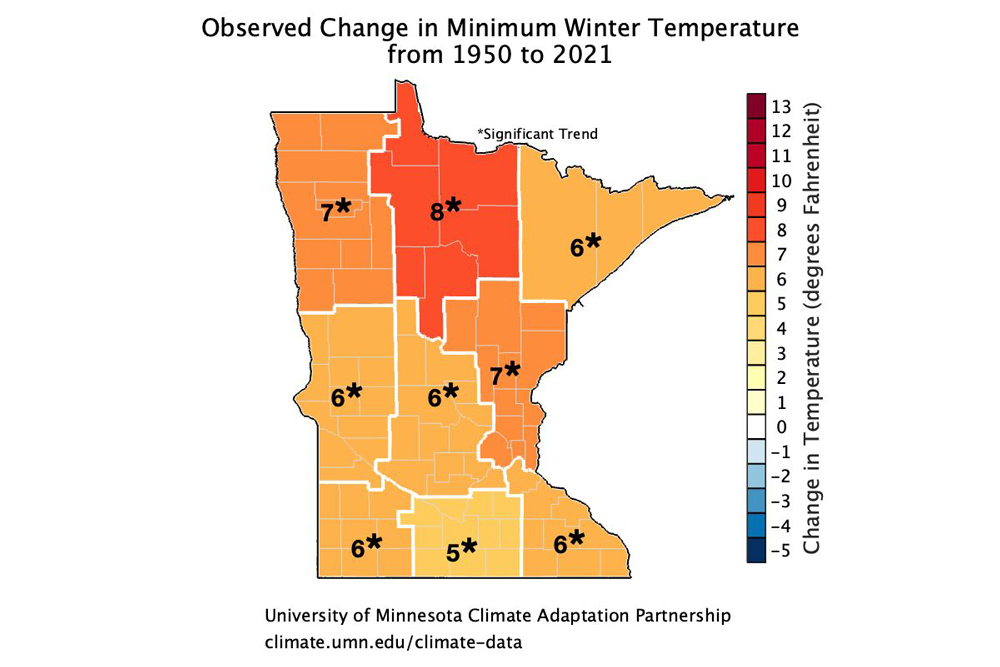
Changing Temperature
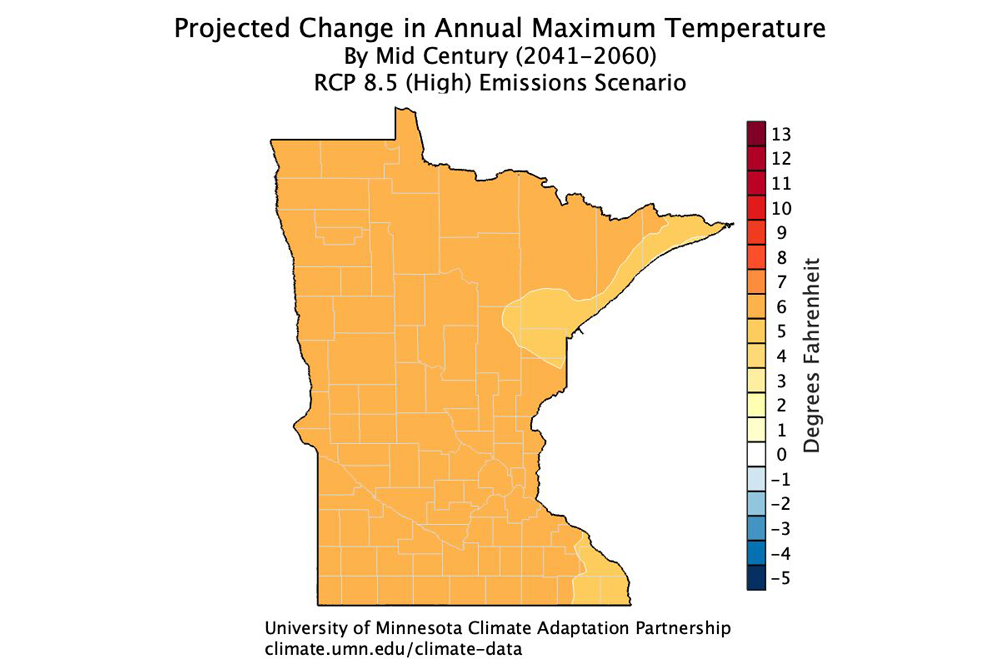
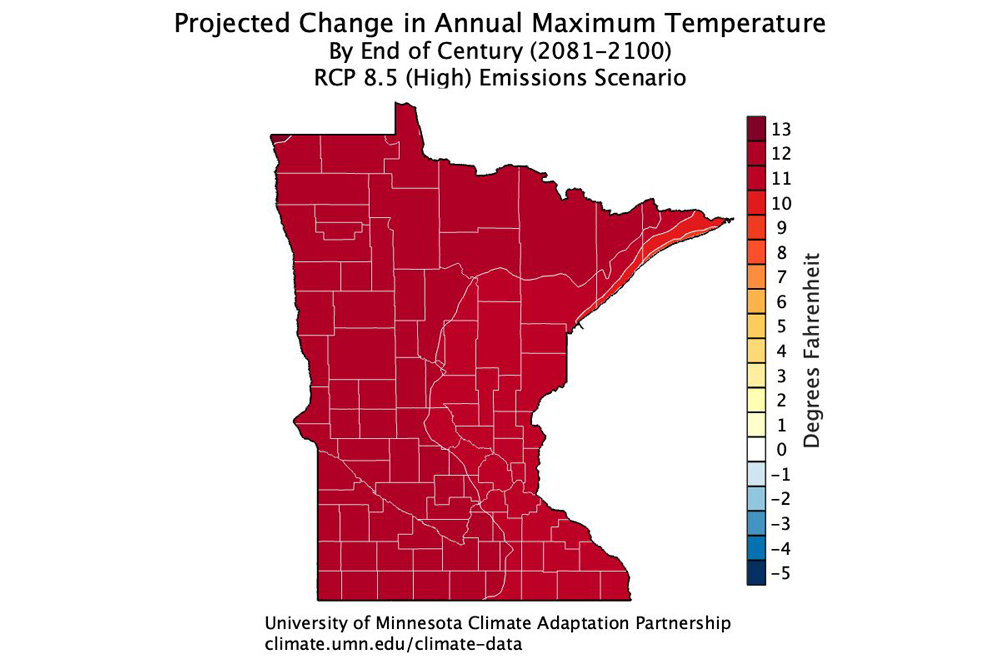
Annual maximum temperature projections
Observed change in minimum winter temp, 1950-2021
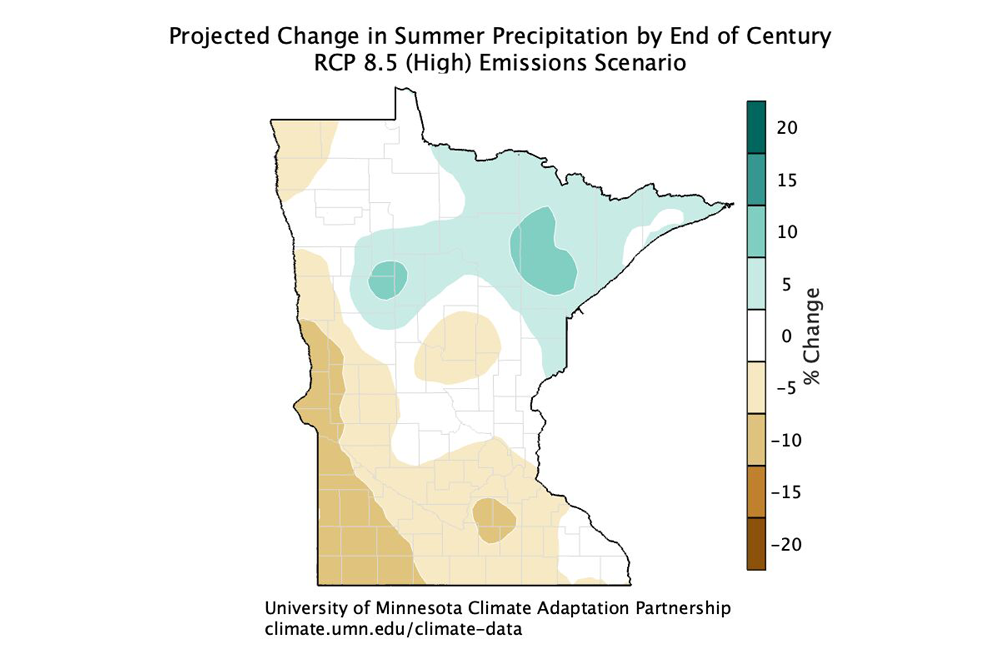
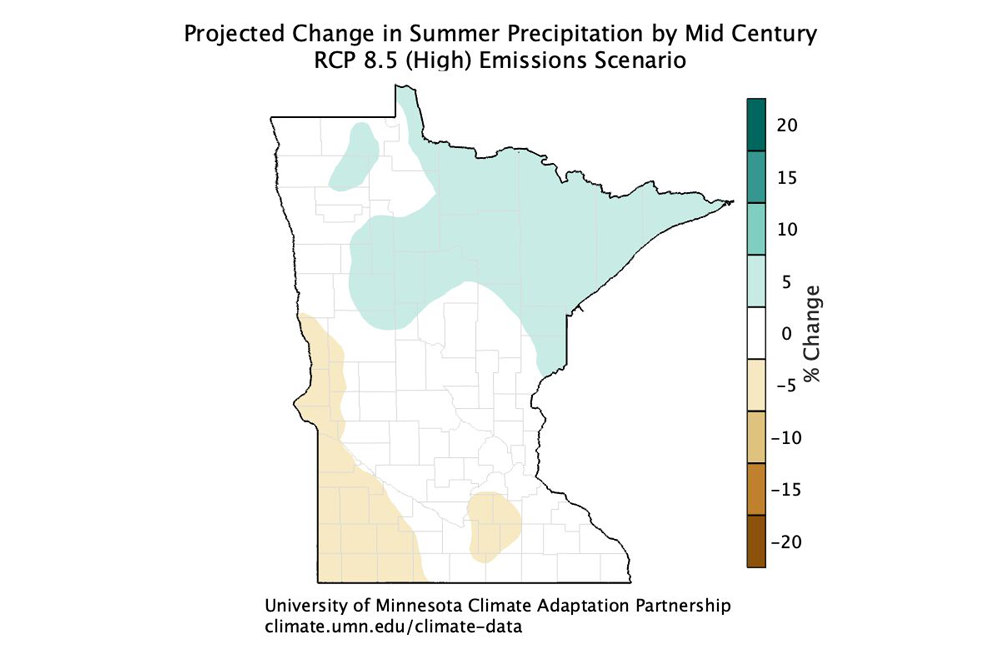
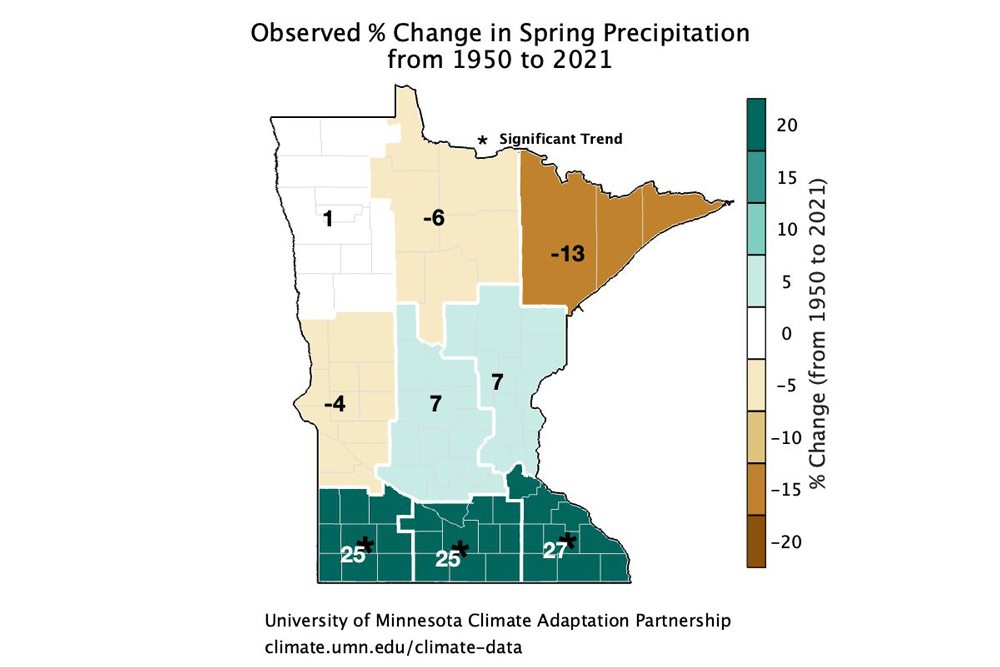
Changing Precipitation
Projected change in summer precipitation
Observed percent change in spring precipitation
Glossary of Terms
Emission Scenarios:
1. Representative Concentration Pathway 4.5 (RCP4.5) - carbon dioxide emissions peak around 2040 and decrease afterward, so that carbon dioxide concentrations in the atmosphere are steady by 2100
2. Representative Concentration Pathway 8.5 (RCP8.5) - carbon dioxide emissions and atmospheric concentrations increase through 2100
Statistical downscaling - developing a statistical relationship between large-scale climate model output and local climate variables and using that relationship to project changes at the local scale. These projections use Coupled Model Intercomparison Project Phase 5 (CMIP5) models.
Citations
Maps courtesy of the University of Wisconsin Center for Climatic Research. Downscaled data is from the University of Wisconsin Probabilistic Downscaling v2.0.
Kirchmeier, M. C., D. J. Lorenz, and D. J. Vimont, 2014: Statistical downscaling of daily wind speed variations. Journal of Applied Meteorology and Climatology, 53. doi:10.1175/JAMC-D-13-0230.1.
Kirchmeier-Young, M. C., D. J. Lorenz, and D. J. Vimont, 2016: Extreme event verification for probabilistic downscaling. Journal of Applied Meteorology and Climatology, 55, 2411–2430. doi:10.1175/JAMC-D-16-0043.1.
Wu, S., M. Markus, D. Lorenz, J. R. Angel, and K. Grady, 2019: A comparative analysis of the historical accuracy of the point precipitation frequency estimates of four data sets and their projections for the Northeastern United States. Water (Switzerland), 11. doi:10.3390/w11061279.