Our Changing Extremes
Since 1916, the amount of rain that falls during the annual largest storm in Minnesota has increased by more than an inch.
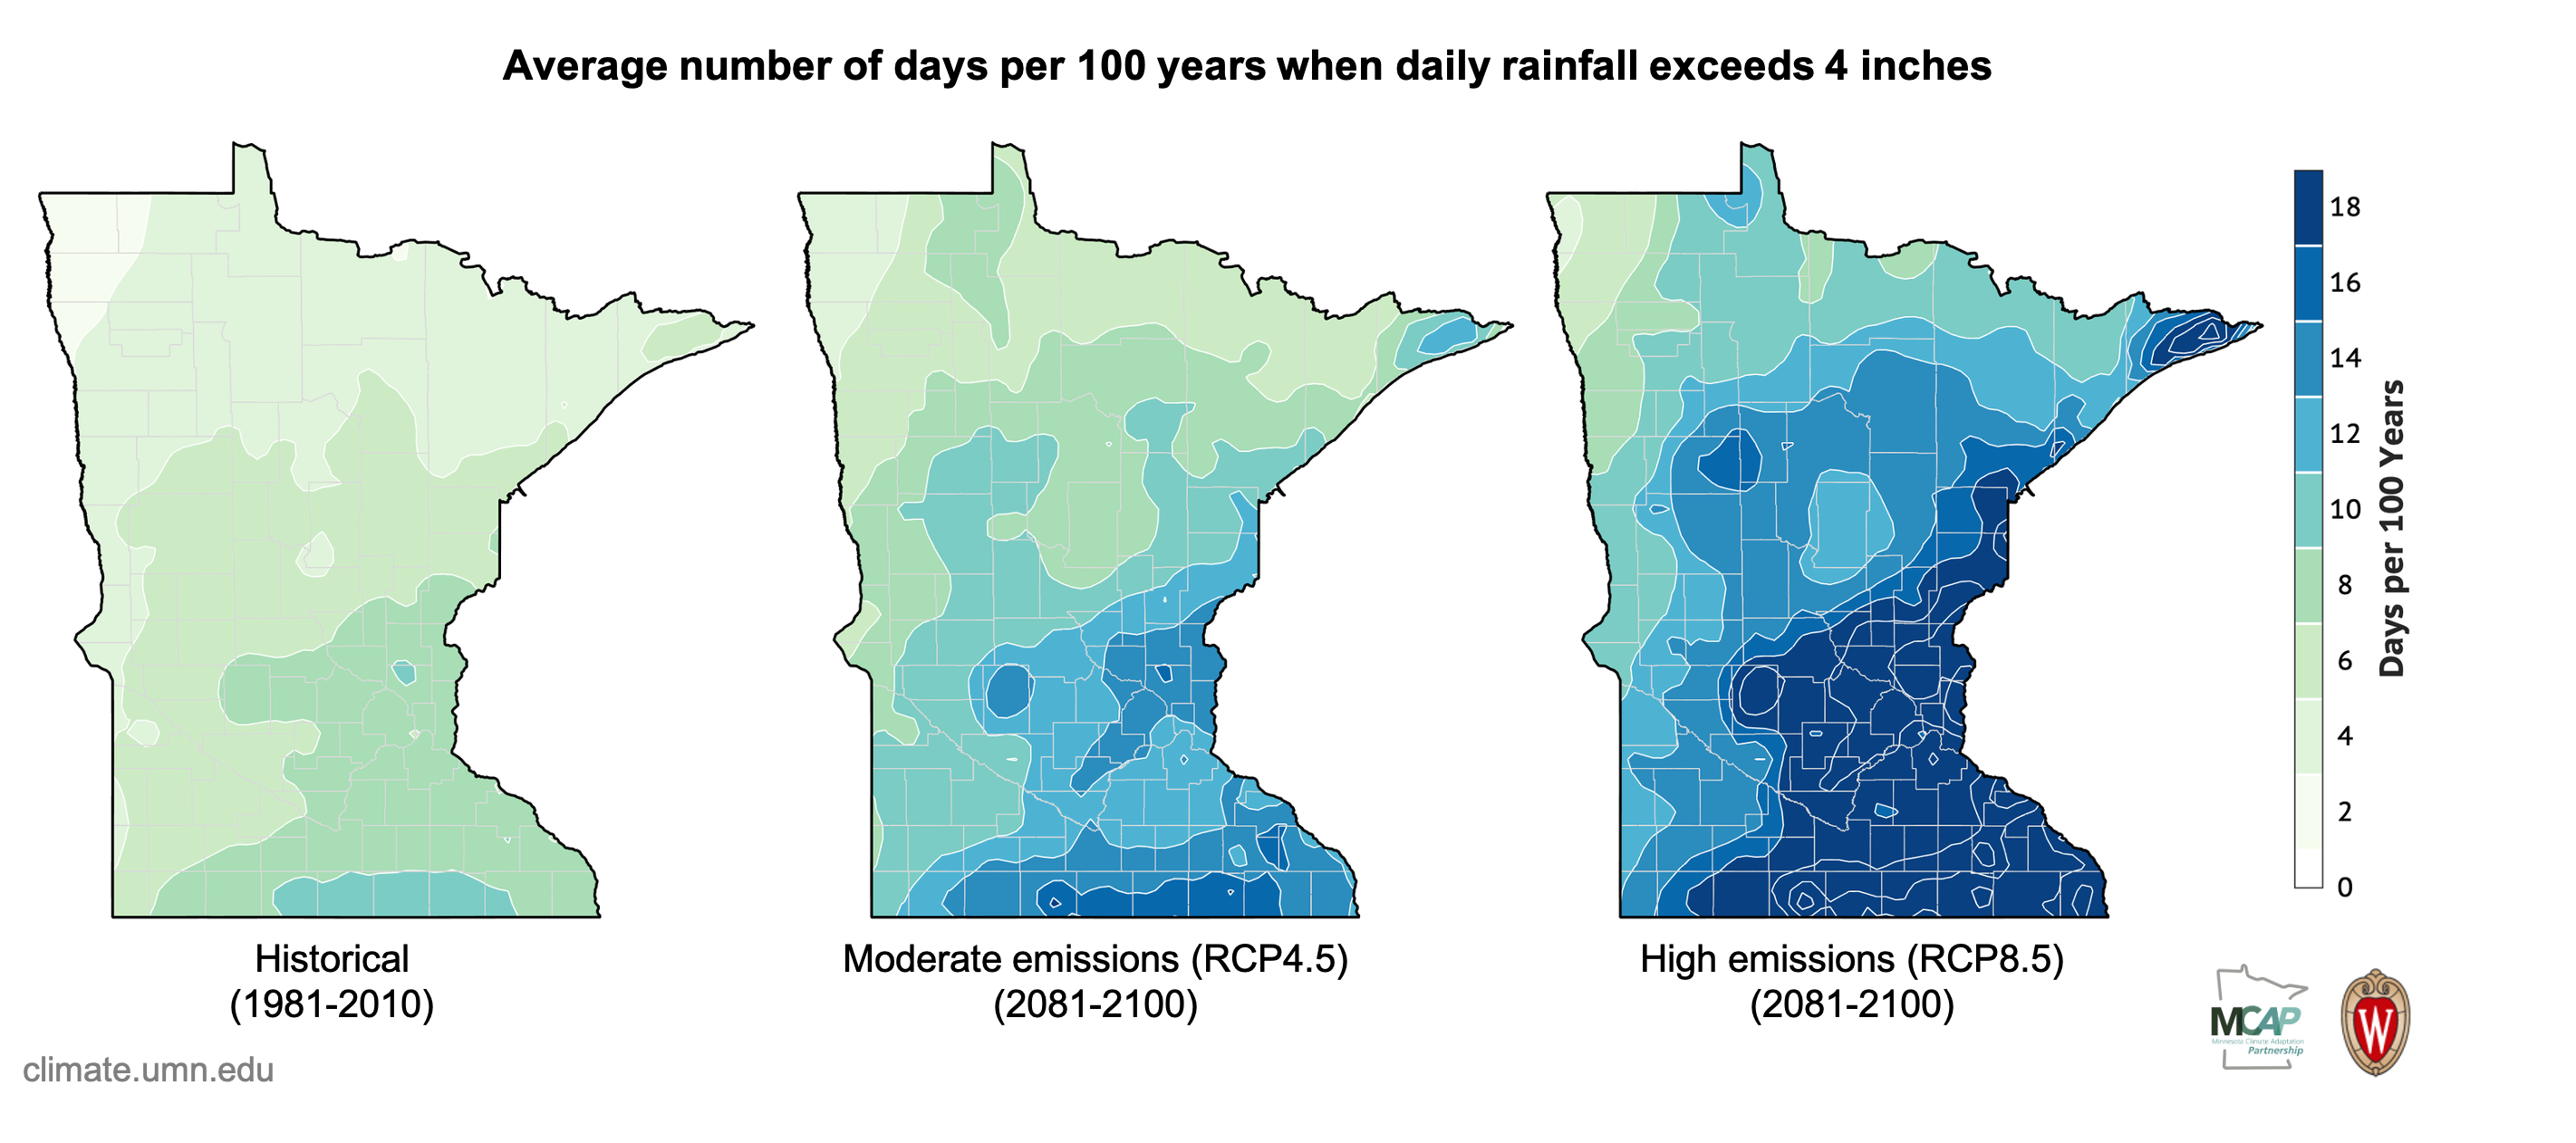
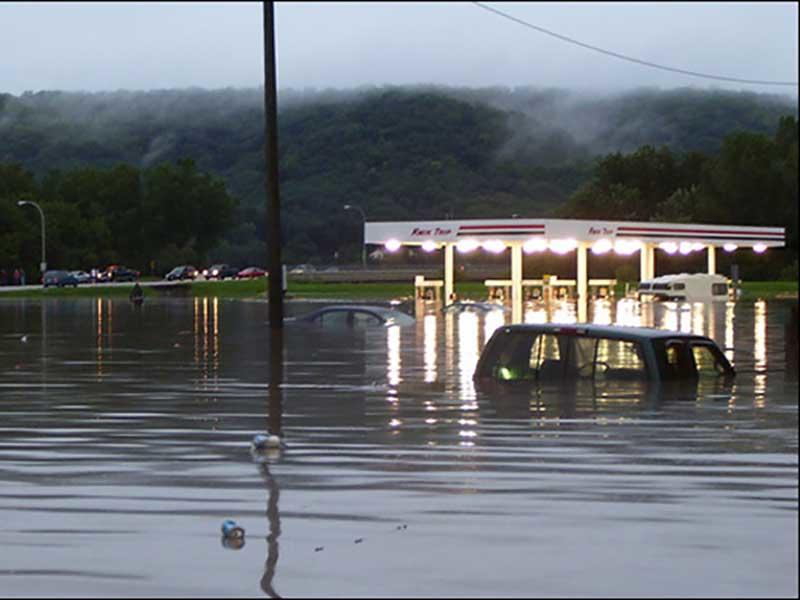
Not only has the average yearly maximum rain event become more extreme, but the most damaging extreme events also have become more common. Climatologists in Minnesota use the term "mega-rain" when at least six inches of rain fall over an area of at least 1,000 square miles. These huge storm events cause extensive flooding and infrastructure damage. According to Minnesota's State Climatology Office, Minnesota had 16 mega-rain events between 1973 and 2021, but 11 of those occurred since 2000. In other words, Minnesota mega-rains have been over two times more common during the first 22 years of the 21st century than during the last 27 years of the 20th century.

(Maps modified from University of Wisconsin Probabilistic Downscaling v2.0. | David Lorenz and the Nelson Institute Center for Climatic Research.)
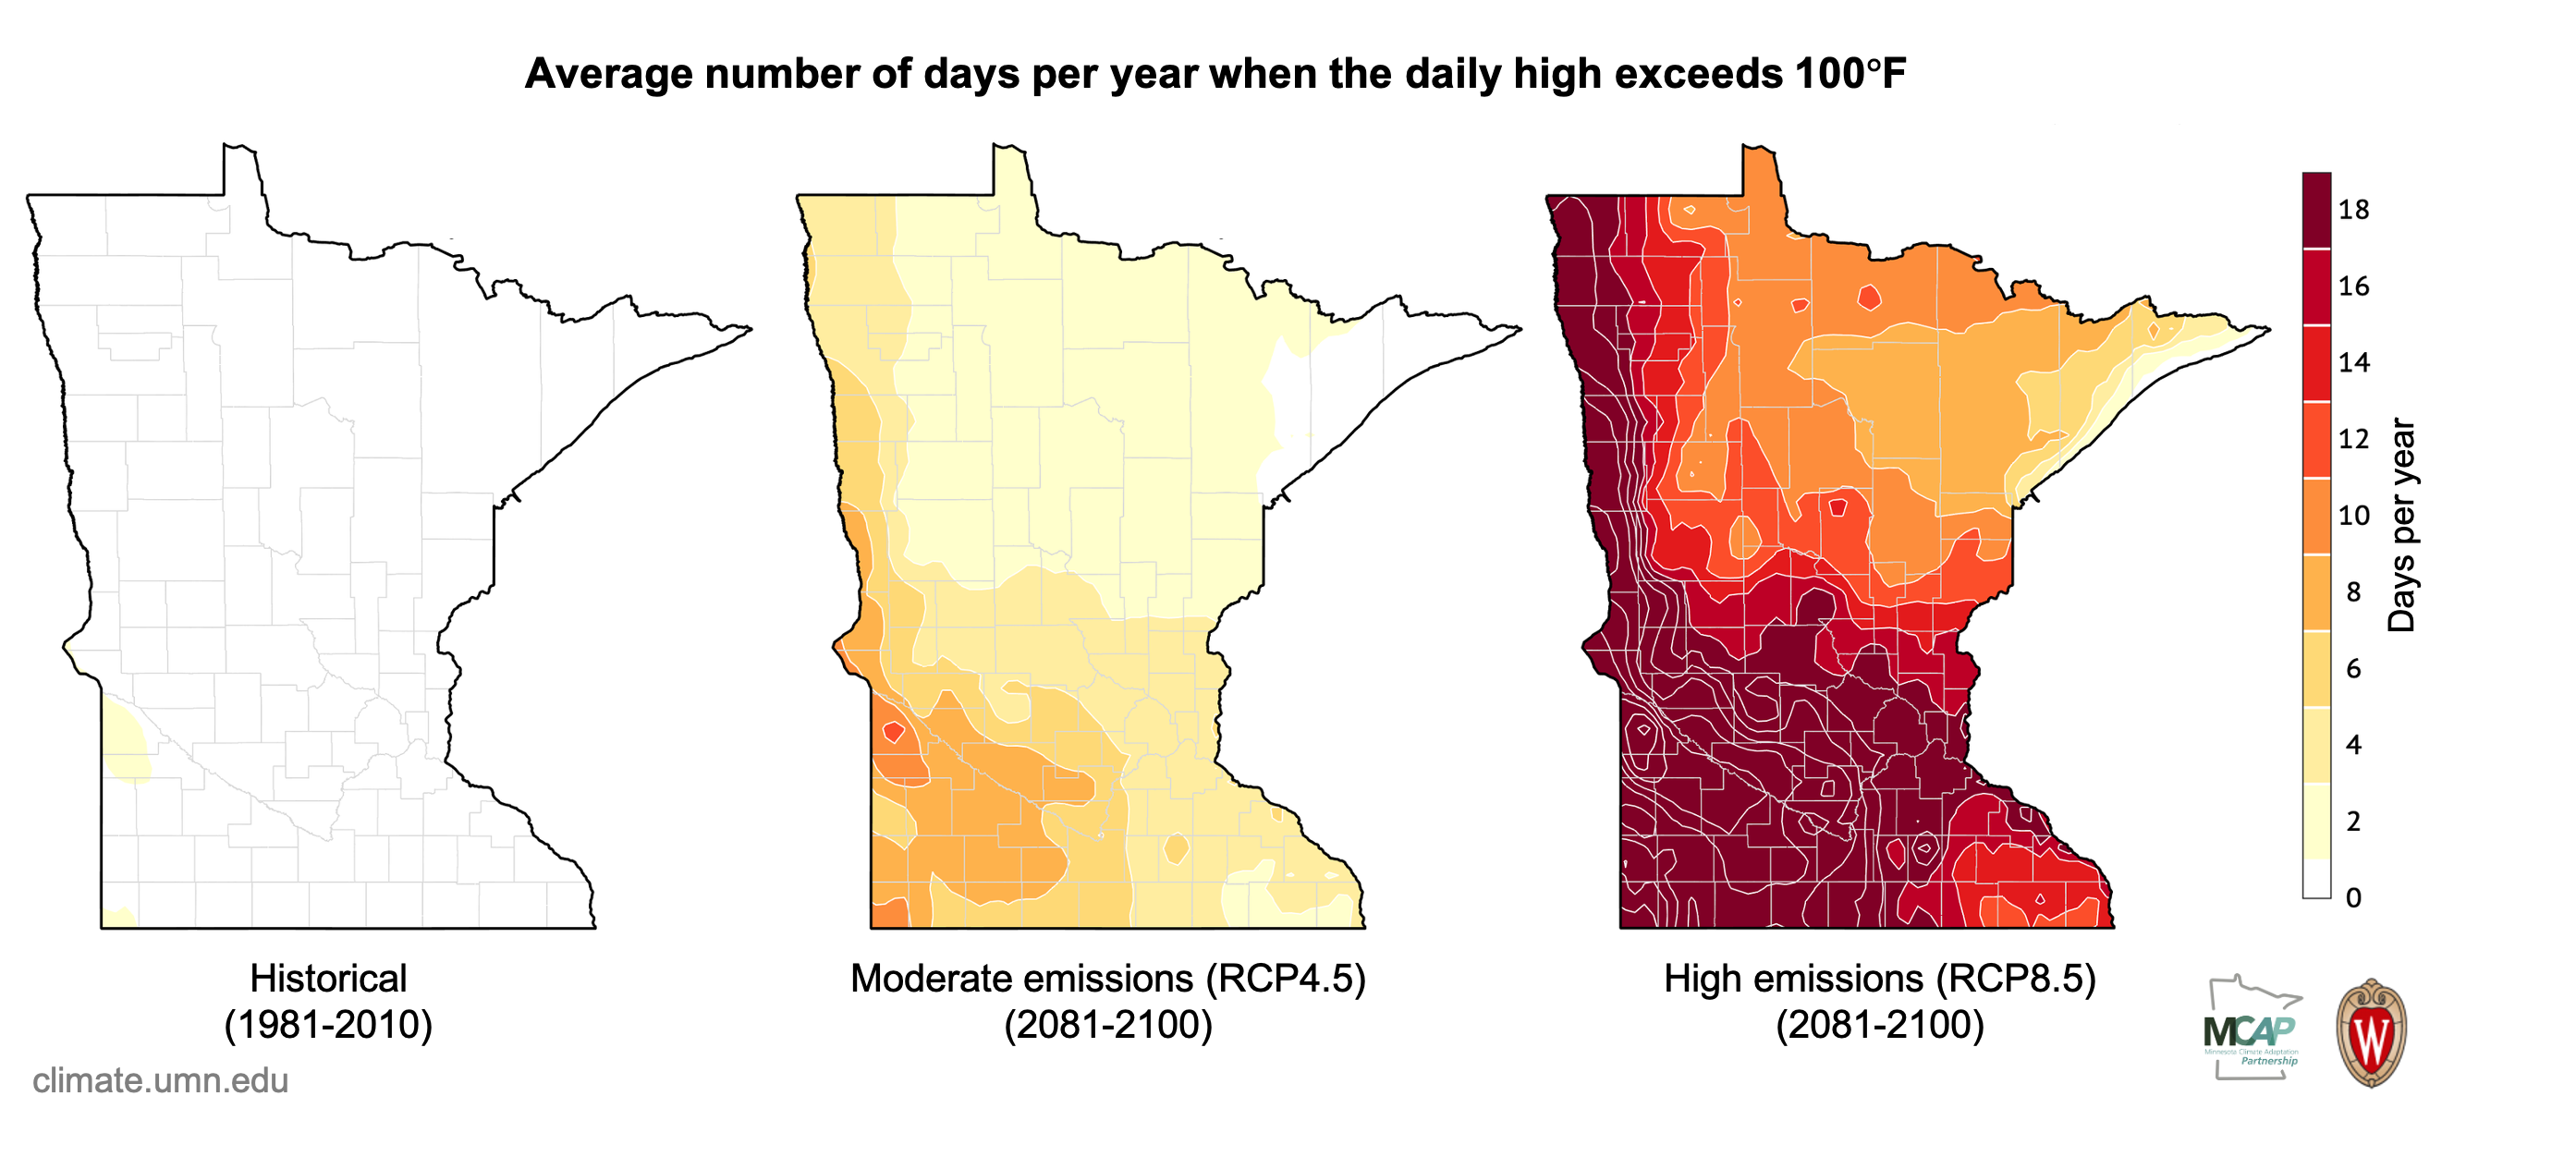
A heatwave can be defined as a series of at least 4 days with air temperatures that would normally only occur about once every 10 years. So far there is no evidence of increasing very hot days in Minnesota, but these days are projected to become more frequent under different climate change scenarios. Climate change might make heat waves stronger and longer. As the average temperature goes up, the same relative increase in temperature during a heat wave would result in a hotter absolute temperature. For example, if a region's average temperature in July is 75 degrees Fahrenheit and a typical heatwave is when the temperature is 15 degrees Fahrenheit above normal, then the heatwave temperature is about 90 degrees Fahrenheit. But if the region's average July temperature increases to 80 degrees Fahrenheit, then a similar increase of 15 degrees Fahrenheit would result in a heatwave of 95 degrees Fahrenheit. This also doesn't account for a possible "tipping point", where moving into a new temperature range can result in a much larger change in heat waves. As the climate warms, heat waves will get excessively hotter.

(Maps modified from University of Wisconsin Probabilistic Downscaling v2.0. | David Lorenz and the Nelson Institute Center for Climatic Research.)
Consequences
References & Suggested Reading
Ebi, K.L., et al., 2008: Effects of global change on human health. In: Analyses of the Effects of Global Change on Human Health and Welfare and Human Systems, pp. 39-87, URL.
Federal Emergency Management Agency (FEMA), 2021. "Ready: Floods". url: http://www.ready.gov/floods.
Great Lakes Integrated Sciences and Assessments, 2021. URL.
Harding, K. J., and P. K. Snyder, 2014: Examining future changes in the character of Central U.S. warm-season precipitation using dynamical downscaling. Journal of Geophysical Research: Atmospheres, 119, doi:10.1002/2014JD022575.
Harding, K. J., and P. K. Snyder, 2015: Using dynamical downscaling to examine mechanisms contributing to the intensification of Central U.S. heavy rainfall events. Journal of Geophysical Research: Atmospheres, 120, doi:10.1002/2014JD022819.
USGCRP, 2018: Impacts, Risks, and Adaptation in the United States: Fourth National Climate Assessment, Volume II [Reidmiller, D.R., C.W. Avery, D.R. Easterling, K.E. Kunkel, K.L.M. Lewis, T.K. Maycock, and B.C. Stewart (eds.)]. U.S. Global Change Research Program, Washington, DC, USA, 1515 pp. doi: 10.7930/NCA4.2018.


